Tissot Indicatrix - Examining the distortion of map projections
The Tissot Indicatrix is a valuable tool for showing the distortions caused by map projections. It is essentially a series of imaginary polygons that represent perfect circles of equal area on a 3D globe. When projected onto a 2D map, their shape, size and/or angles will be distorted accordingly allowing you to quickly assess the projection’s accuracy for a given part of the globe.
I’ve seen great Tissot diagrams in text books but I wanted to create the indicatrix as a polygon dataset so that I could project and overlay it with other data in a GIS. To do this I wrote a python script using the OGR libraries, which I will revist in a minute. But first the visually interesting part:
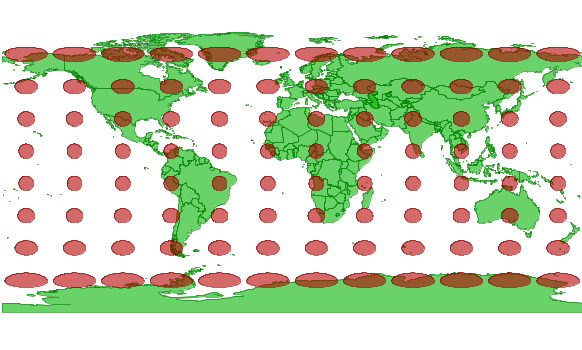
Here is a world countries shapefile overlaid with the Tissot circles in geographic (unprojected lat-long) coordinates:

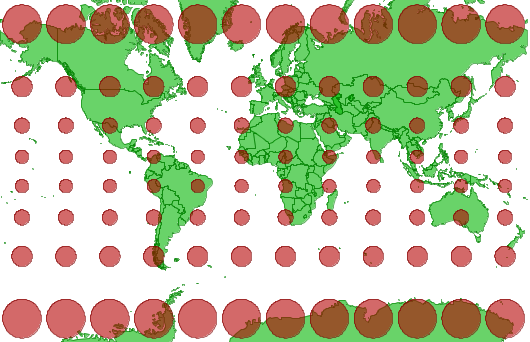
Next I reprojected the datasets to the Mercator projection using ogr2ogr:
ogr2ogr -t_srs "+proj=merc" countries_merc.shp countries_simpl.shp countries_simpl
ogr2ogr -t_srs "+proj=merc" tissot_merc.shp tissot.shp tissot
Note that the angles are perfectly preserved (the trademark feature of the Mercator projection) but the size is badly distorted.

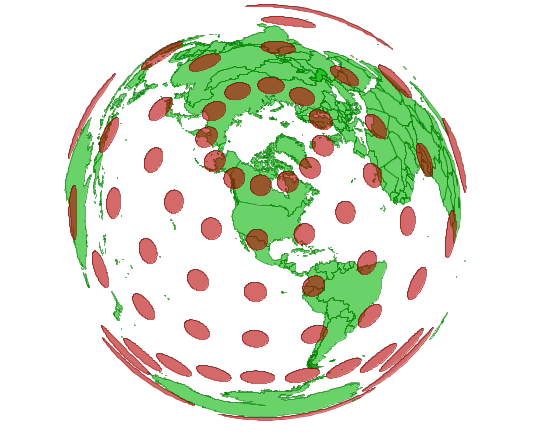
Now lets try Lambert Azimuthal Equal Area (in this case the US National Atlas standard projection - EPSG code 2163).
ogr2ogr -t_srs "epsg:2163" countries_lambert.shp countries_simpl.shp countries_simpl
ogr2ogr -t_srs "epsg:2163" tissot_lambert.shp tissot.shp tissot
This is a great projection for preserving area but get outside the center and shapes become badly distorted:

The best way to experiment with this is to bring the tissot.shp file into ArcMap (or another program that supports on-the-fly projection) and play with it in real time. The distortions of every projection just leap off the screen…
OK, now for the geeky part. Here’s the python/OGR script used to create the tissot shapefile. The basic process is to lay out a grid of points across the globe in latlong, loop through the points and reproject each one to an orthographic projection centered directly on the point, buffer it, then reproject to latlong. The end result is a latlong shapefile representing circles of equal area on a globe.
 #!/usr/bin/env python
 # Tissot Circles
 # Represent perfect circles of equal area on a globe
 # but will appear distorted in ANY 2d projection.
 # Used to show the size, shape and directional distortion
 # by Matthew T. Perry
 # 12/10/2005

 import ogr
 import os
 import osr

 output = 'tissot.shp'
 debug = False

 # Create the Shapefile
 driver = ogr.GetDriverByName('ESRI Shapefile')
 if os.path.exists(output):
         driver.DeleteDataSource(output)
 ds = driver.CreateDataSource(output)
 layer = ds.CreateLayer(output, geom_type=ogr.wkbPolygon)

 # Set up spatial reference systems
 latlong = osr.SpatialReference()
 ortho = osr.SpatialReference()
 latlong.ImportFromProj4('+proj=latlong')

 # For each grid point, reproject to ortho centered on itself,
 # buffer by 640,000 meters, reproject back to latlong,
 # and output the latlong ellipse to shapefile
 for x in range(-165,180,30):
     for y in range (-60,90,30):
         f= ogr.Feature(feature_def=layer.GetLayerDefn())
         wkt = 'POINT(%f %f)' % (x, y)
         p = ogr.CreateGeometryFromWkt(wkt)
         p.AssignSpatialReference(latlong)
         proj = '+proj=ortho +lon_0=%f +lat_0=%f' % (x,y)
         ortho.ImportFromProj4(proj)
         p.TransformTo(ortho)
         b = p.Buffer(640000)
         b.AssignSpatialReference(ortho)
         b.TransformTo(latlong)
         f.SetGeometryDirectly(b)
         layer.CreateFeature(f)
         f.Destroy()

 ds.Destroy()
blog comments powered by Disqus
