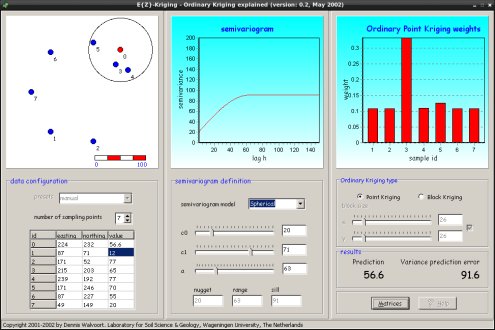
So you want to learn to learn about kriging …
Guides like Tomislav Hengl’s Practical Guide to Geostatistical Mapping of Environmental Variables and Rossiter’s Introduction to applied geostatistics do an excellent job of providing a grounded, relatively easy to understand, introduction to geostatical prediction and kriging.
But if you’re an experience learner (like me) you don’t absorb the mathematics fully without doing something with the knowledge; Seeing it in action brings the concepts to life. Unfortunately most geostats/kriging software is either too complex for exploratory learning (not enough immediate feedback) or too simplistic (making too many assumptions, disallowing access to the nitty-gritty details). Either way, you’re bound to produce output with fundamental flaws because you’re not aware of the finer details of variogram modelling. I speak from exerience!
Luckily Dennis J. J. Walvoort of the Wageningen University & Research Center saw the same problem and created an nifty learning to to explore varigoram models and spatial predictions using ordinary kriging - EZ-Kriging. No degree in math or statistical theory required. Just drag the points around, play with the parameters and alter the underlying data as a table and see the results immediately.
Its nothing more than a simulation so don’t expect to load your own datasets or produce any meaningful output with it. But it truly excels as a learning tool to understand the core concepts behind kriging and is a great complement to Hengl and Rossiter’s work. With that knowledge you can do the real deal in Surfer, R, ILWIS or your geostats software of choice.
EDIT: One complaint about this EZ-Kriging that I have: it doesn’t show the observed sample variogram cloud overlayed on the variogram model. Oh well still a nice tool.
EDIT2: It’s a windows .exe but it runs smoothly under wine in linux.
blog comments powered by Disqus

